
Logging
Broadly, there are two types of logs you may be interested in. On cluster for the applications you are running inside your cluster, and at an infrastructure level for the applications which are responsible for running the cluster itself.
As Charmed Kubernetes is pure Kubernetes, you can use any of the tools and techniques to examine cluster logs as described in the Kubernetes documentation. Security related logging is enabled by default and is described in more detail in the Audit logging section. Additionally, you can deploy Graylog alongside your cluster - please see the section on Graylog below.
For the infrastructure, your Charmed Kubernetes deployment has centralised logging set up by default. Each unit in your cluster automatically sends logging information to the controller based on the current logging level. You can use the Juju command line to easily inspect these logs and to change the logging level, as explained below.
Viewing logs
To view the logs from the current controller and model, simply run:
juju debug-log
The default behaviour is to show the last 10 entries and to tail the log (so
you will need to terminate the command with Ctrl-C).
The output is in the form:
<entity> <timestamp> <log-level> <module>[:<line-no>] <message>
For example, a typical line of output might read:
unit-kubernetes-control-plane-0: 18:04:11 INFO juju.cmd running jujud [2.4.2 gc go1.10]
The entity is the unit, machine or application the message originates from (in
this case kubernetes-control-plane/0). It can be very useful to filter the output
based on the entity or log level, and the debug-log command has many options.
For a full description, run the command juju help debug-log or see the
Juju documentation. Some useful examples are outlined below.
Useful examples
View the last 100 entries and tail the log:
juju debug-log -n 100
Show the last 20 entries and exit:
juju debug-log -n 20 --no-tail
Replay the log from the very beginning, but filter to logs from kubernetes-worker/0:
juju debug-log --replay --include=kubernetes-worker/0
Viewing logs on a machine
If it becomes necessary for any reason, it is also possible to view logs
directly on the running machine. A user with SSH access can connect to the
relevant machine and find the logs for all the units running on that machine in
the directory /var/logs/juju. The juju ssh command can be used for this,
and you can connect to the relevant machine using a unit identifier. So for
example, to look at the logs on the machine running the first unit of
kubernetes-worker you can run the following:
juju ssh kubernetes-worker/0
ls /var/logs/juju/
Which should show something similar to:
machine-1.log machine-lock.log unit-flannel-1.log unit-kubernetes-worker-0.log
Note that the logs from other units (in this case 'flannel') running on this machine can also be found here.
Logging level
You can check the current logging level by running the command:
juju model-config logging-config
This will result in output similar to:
<root>=WARNING;unit=DEBUG
...which is the default for any Juju model. This indicates that the machine log level is set to 'WARNING', and the unit logging level is set to 'DEBUG'. As all the software components of your kubernetes cluster run in units, these logs are likely to be useful for diagnosing issues with software.
The logging levels, from most verbose to least verbose, are as follows:
- TRACE
- DEBUG
- INFO
- WARNING
- ERROR
The logging level can be set like this:
juju model-config logging-config="<root>=WARNING;unit=TRACE"
...which in this case sets the logging level for all units to TRACE
Additional information
As previously mentioned, you can see more detailed information on accessing the logs from your cluster in the Juju documentation, including the following:
- Altering the agent logging setup
- Setting up remote logging
- More advanced filtering and additional examples
Cluster logs with Graylog
The recommended way to retrieve logs from your cluster is to use a combination of Elasticsearch, Graylog and Filebeat. These provide a dashboard from which you can monitor both machine-level and cluster-level logs.
Installation
You can install Charmed Kubernetes with Graylog logging using the Juju bundle along with the following overlay file (download it here):
applications:
  apache2:
    charm: apache2
    num_units: 1
    expose: true
    options:
      enable_modules: "headers proxy_html proxy_http"
  elasticsearch:
    charm: elasticsearch
    constraints: mem=7G root-disk=16G
    num_units: 1
    options:
      apt-repository: "deb https://artifacts.elastic.co/packages/6.x/apt stable main"
  filebeat:
    charm: filebeat
    options:
      install_sources: "deb https://artifacts.elastic.co/packages/6.x/apt stable main"
      kube_logs: True
  graylog:
    charm: graylog
    constraints: mem=7G root-disk=16G
    num_units: 1
    options:
      channel: "3/stable"
  mongodb:
    charm: mongodb
    num_units: 1
    options:
      extra_daemon_options: "--bind_ip_all"
relations:
  - ["apache2:reverseproxy", "graylog:website"]
  - ["graylog:elasticsearch", "elasticsearch:client"]
  - ["graylog:mongodb", "mongodb:database"]
  - ["filebeat:beats-host", "kubernetes-control-plane:juju-info"]
  - ["filebeat:beats-host", "kubernetes-worker:juju-info"]
  - ["filebeat:logstash", "graylog:beats"]
To use this overlay with the Charmed Kubernetes bundle, specify it during deploy like this:
juju deploy charmed-kubernetes --overlay logging-egf-overlay.yaml
If you wish to add Graylog logging to an existing deployment, you can export a bundle of your current environment and then redeploy it on top of itself with the overlay:
juju export-bundle --filename mybundle.yaml
juju deploy ./mybundle.yaml --overlay logging-egf-overlay.yaml
At this point, all the applications can communicate with each other. To enable the Graylog web interface, configure the reverse proxy with the following template (download it here):
<Location "/">
    RequestHeader set X-Graylog-Server-URL "http://{{servername}}/"
    ProxyPass http://{{graylog_web}}/
    ProxyPassReverse http://{{graylog_web}}/
</Location>
Use the above template to configure apache2 like this:
juju config apache2 vhost_http_template="$(base64 graylog-vhost.tmpl)"
Using Graylog
Now that we have everything configured, you'll need to know the web server IP address and Graylog admin password so you can login:
juju status --format yaml apache2/0 | grep public-address
    public-address: <your-apache2-ip>
juju run graylog/0 show-admin-password
    admin-password: <your-graylog-password>
Browse to http://<your-apache2-ip> and login with admin as the username
and <your-graylog-password> as the password.
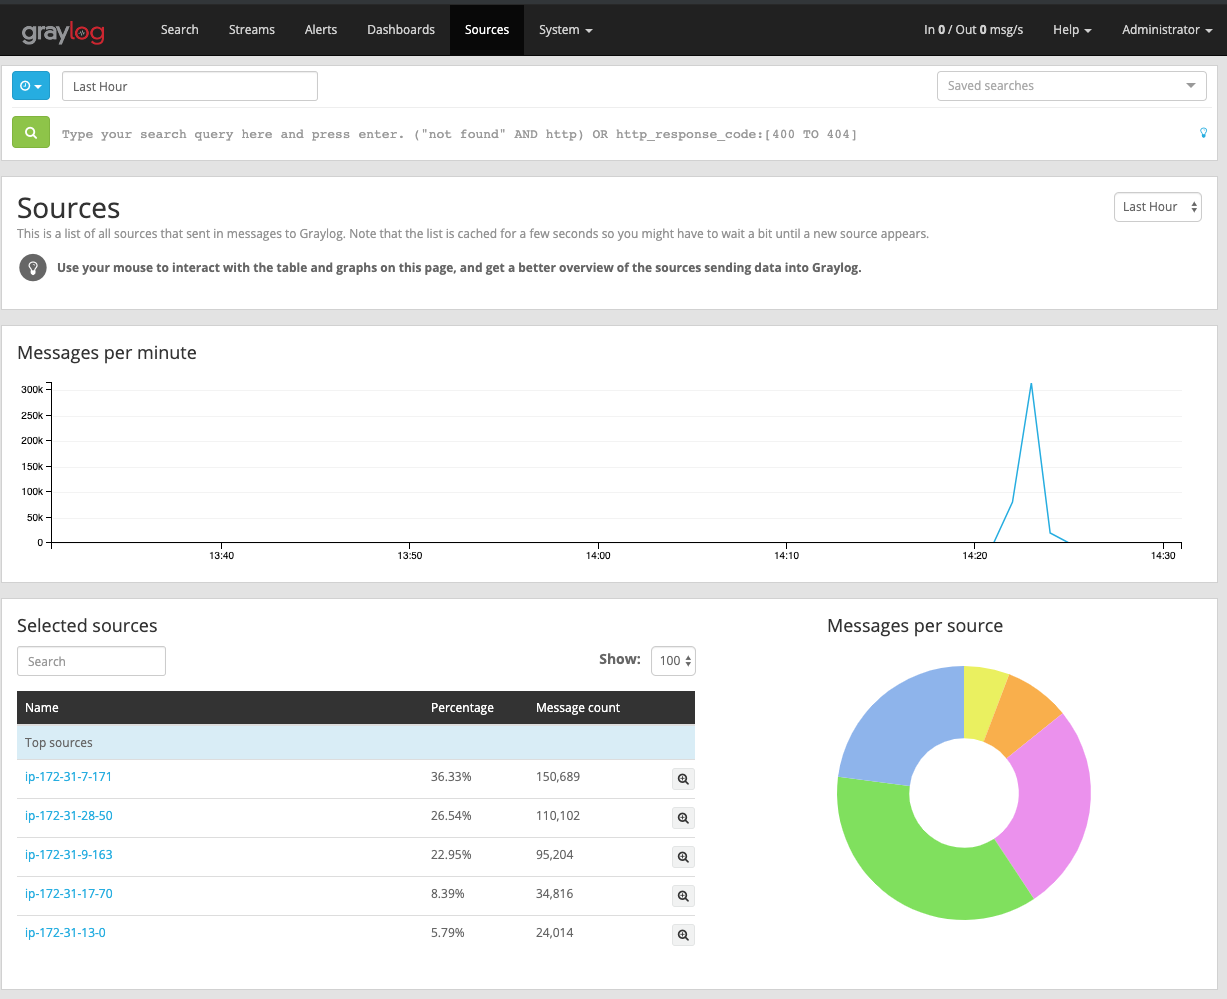
Once logged in, head to the Sources tab to get an overview of the logs
collected from our K8s master and workers:
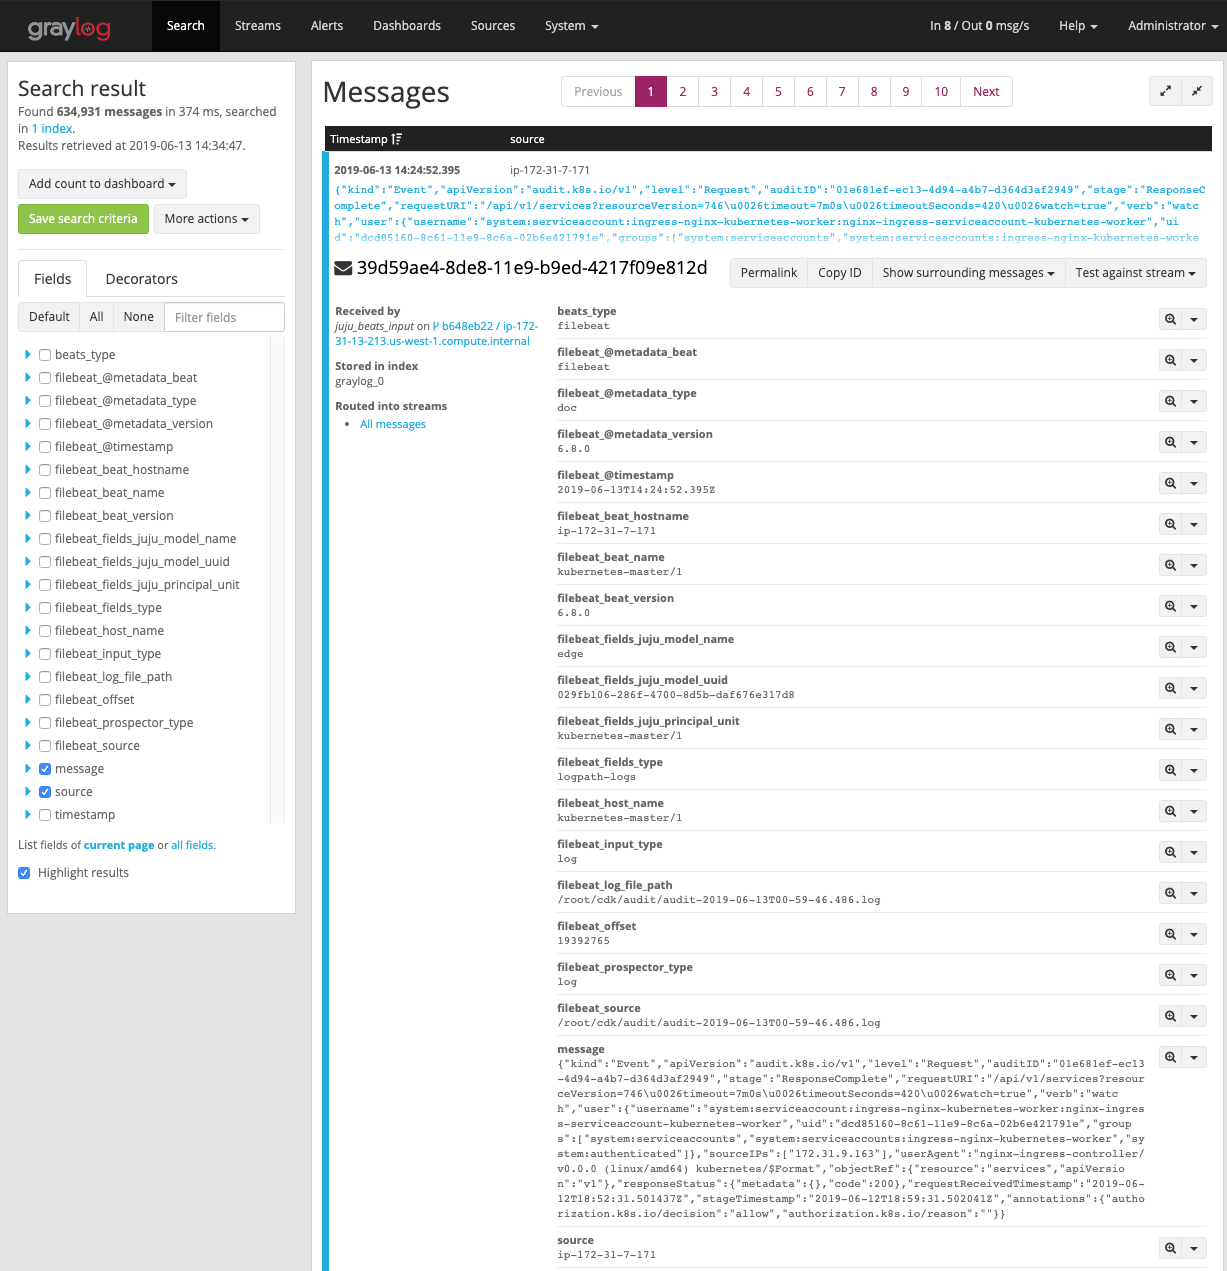
Drill into those logs by clicking the System / Inputs tab and selecting
Show received messages for the filebeat input:
From here, you may want to explore various filters or setup Graylog dashboards to help identify the events that are most important to you. Check out the Graylog Dashboard docs for details on customising your view.
See the guide to contributing or discuss these docs in our public Mattermost channel.