Duration: 3 minutes
Before you get started!
Welcome to OpenStack!
In this series of tutorials, we will walk you through all the necessary steps to install, configure and get started with OpenStack. Using just three dedicated machines, you will learn how to deploy OpenStack in highly available, multi-node, production-grade clusters.
This tutorial is the fifth in the “Phase II - Deploying OpenStack” series.
What is OpenStack?
OpenStack is a collection of open source projects designed to work together to form the basis of a cloud. OpenStack can be used for both private and public cloud implementation.
What is Sunbeam?
Sunbeam is an upstream project under the governance of the OpenInfra Foundation (OIF), which was created to lower the barrier to entry for OpenStack, simplify its adoption process, and set the foundation for an autonomous private cloud. Sunbeam uses cloud-native architecture and total bottom-up automation to make OpenStack more accessible to newcomers and to help users get to grips with the platform immediately.
What is MicroStack?
MicroStack (based on Sunbeam) is an OpenStack distribution designed for small-scale cloud environments. While it is available with full commercial support from Canonical, it can also be self-deployed with no friction, effectively eliminating the need for a paid consulting engagement. MicroStack currently includes core OpenStack services only, but is expected to evolve quickly to ensure full feature parity with Canonical’s Charmed OpenStack soon.
In this tutorial, you will learn how to:
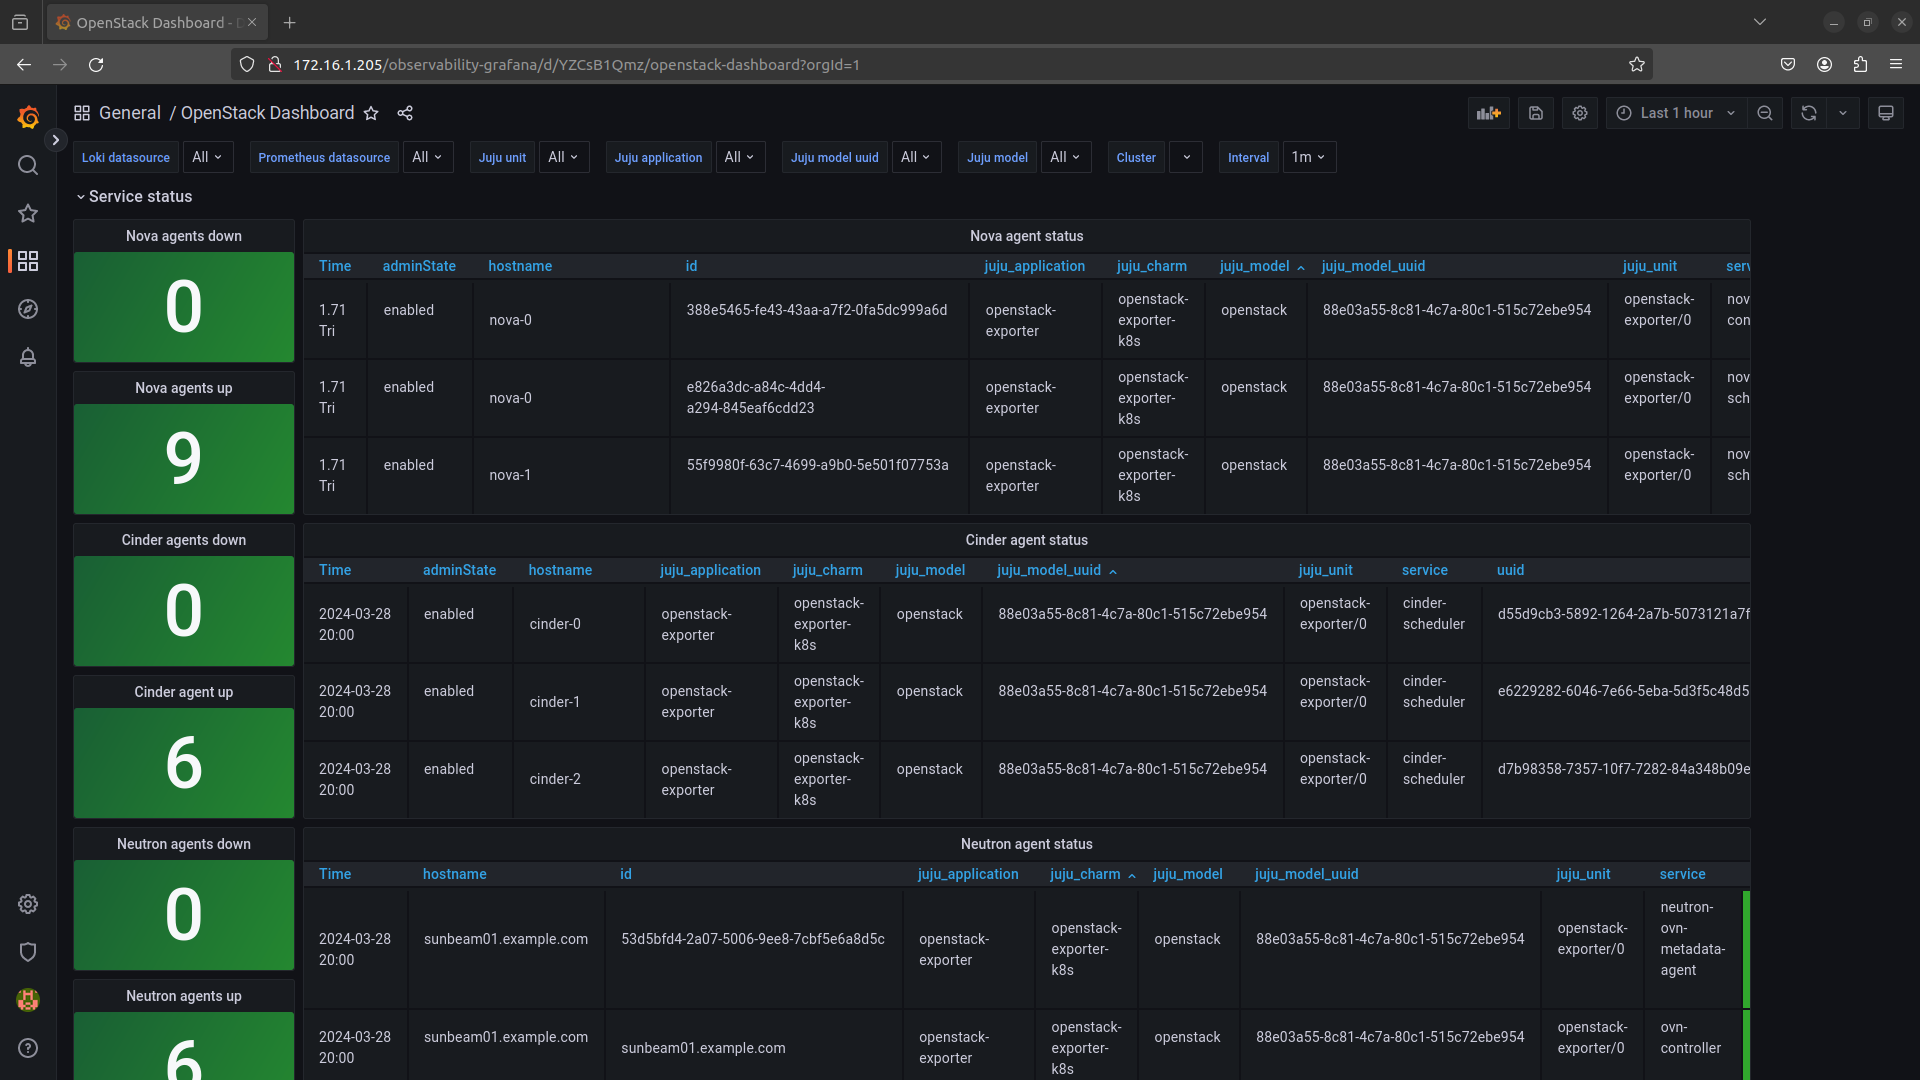
- Enable the Observability plugin
- Use the Canonical Observability Stack (COS) to monitor your OpenStack cloud
You will only need:
- Theoretical knowledge of OpenStack gained by completing all tutorials in the “Phase I - Learning OpenStack” series
- Three fresh physical machines with:
- The latest Ubuntu LTS installed
- A minimum of 32 GB of free memory
- 200 GB of SSD storage available on the root disk
- At least one un-partitioned disk of at least 200 GiB in size
- Two network interfaces
- Primary: for access to the OpenStack control plane
- Secondary: for remote access to cloud VMs - OpenStack cloud bootstrapped and configured
- Additional nodes added to the cluster